PyPI · RubyGems98AußergewöhnlichGesundheitsindex

materialsproject/pymatgenPython Materials Genomics (pymatgen) is a robust materials analysis code that defines classes for structures and molecules with support for many electronic structure codes. It powers the Materials Project.
Python · Polar★ 1.963↓ 763.4K/Monat10. Sept. 2026
npm98AußergewöhnlichGesundheitsindex

mermaid-js/mermaidGeneration of diagrams like flowcharts or sequence diagrams from text in a similar manner as markdown
TypeScript · Mermaid · JavaScript★ 90.8K↓ 147M/Monat19. Okt. 2026
npm97AußergewöhnlichGesundheitsindex

clientIO/jointA proven SVG-based JavaScript diagramming library powering exceptional UIs
JavaScript · TypeScript★ 5.386↓ 224.7K/Monat19. Sept. 2026
PyPI94AußergewöhnlichGesundheitsindex
HTML · Lobster · Python★ 27↓ 708.2K/Monat9. Sept. 2026
npm93AußergewöhnlichGesundheitsindex

likec4/likec4Visualize, collaborate, and evolve the software architecture with always actual and live diagrams from your code
TypeScript★ 5.555↓ 641.9K/Monat28. Aug. 2026
npm · Maven93AußergewöhnlichGesundheitsindex
Java★ 13.4K↓ 853/Monat14. Okt. 2026
npm91ExzellentGesundheitsindex
TypeScript★ 132.1K↓ 2.1M/Monat16. Sept. 2026
npm90ExzellentGesundheitsindex

penrose/penroseCreate beautiful diagrams just by typing notation in plain text.
TypeScript · HTML★ 7.985↓ 5.521/Monat4. Okt. 2026
crates.io · npm89ExzellentGesundheitsindex
Rust★ 620↓ 134.9K/Monat20. Okt. 2026
npm89ExzellentGesundheitsindex
TypeScript★ 883↓ 65K/Monat24. Sept. 2026
PyPI88ExzellentGesundheitsindex
Python★ 2.446↓ 4.302/Monat20. Sept. 2026
Go88ExzellentGesundheitsindex

d2lang/d2D2 is a modern diagram scripting language that turns text to diagrams.
Go★ 25.5K23. Sept. 2026
PyPI88ExzellentGesundheitsindex
Python · Jinja★ 411↓ 6.3M/Monat27. Aug. 2026
NuGet · npm84ExzellentGesundheitsindex

EvotecIT/ChartForgeXChartForgeX renders polished charts, visual blocks, topology diagrams, and static report visuals from .NET without adding runtime chart dependencies to generated output.
HTML · C#★ 4720. Okt. 2026
Maven · npm84ExzellentGesundheitsindex
JavaScript★ 4.29728. Aug. 2026
npm · RubyGems83ExzellentGesundheitsindex
JavaScript · Ruby★ 175↓ 83.4K/Monat11. Sept. 2026
npm83ExzellentGesundheitsindex
TypeScript★ 4↓ 736/Monat11. Sept. 2026
npm83ExzellentGesundheitsindex

tt-a1i/archifyAgent skill for beautiful, verifiable architecture, workflow, sequence, data-flow, and lifecycle diagrams—self-contained HTML with motion and crisp export.
JavaScript · HTML★ 23.8K↓ 10.3K/Monat28. Aug. 2026
Go81ExzellentGesundheitsindex

k1LoW/ndiagndiag is a high-level architecture diagramming/documentation tool.
Go★ 1944. Okt. 2026
Go80ExzellentGesundheitsindex

madstone-tech/lokoC4 architecture documentation tool with LLM integration via MCP — design systems conversationally, render D2 diagrams, generate beautiful docs
Go · Shell★ 119. Okt. 2026
npm80ExzellentGesundheitsindex

sametcn99/vitepress-mermaid-rendererTransform your static Mermaid diagrams into interactive, dynamic visualizations in VitePress! This powerful plugin brings life to your documentation by enabling interactive features like zooming, panning, and fullscreen viewing.
TypeScript · Vue★ 67↓ 31.7K/Monat10. Sept. 2026
npm · Maven77GutGesundheitsindex

transitrix/transitrix-studioVS Code + IntelliJ IDEA extension for editing and previewing Transitrix diagrams — BPMN, Goals, DGCA, capability maps. Text-first; live preview as you type. MIT licensed.
TypeScript★ 11↓ 2.124/Monat12. Sept. 2026
Go · npm73GutGesundheitsindex

LarsArtmann/go-outputWrite your data once. Render it anywhere. 16 output formats across tables, trees, and diagrams, plus NOM-style real-time progress visualization. Zero heavy deps in root.
Go★ 19. Sept. 2026
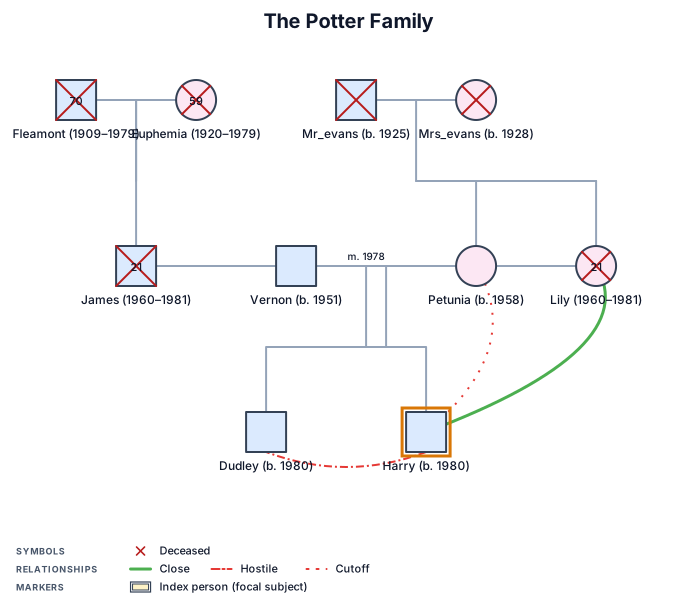
SchemaTex/SchemaTexEvery diagram a doctor, engineer, or lawyer would actually use. Free. Fully open source. Made for AI. 20 industry-standard diagrams from a text DSL. Pure SVG, zero deps.
TypeScript · MDX★ 76↓ 3.340/Monat9. Sept. 2026
PyPI71GutGesundheitsindex
Python★ 49321. Sept. 2026
NuGet71GutGesundheitsindex

lemonlion/KronikolA mechanism for tracking the request-responses in your tests and converting them into PlantUML diagrams.
C#★ 1723. Aug. 2026

diagrammo/dgmo-mcpRender 32 diagram and chart types to SVG/PNG with browser preview and HTML reports.
TypeScript · JavaScript★ 3↓ 3.856/Monat9. Sept. 2026

winlp4ever/canvas-harnessLightning-fast canvas-rendered, headless node-graph & whiteboard library for React. Scales past where React Flow and Excalidraw slow down.
TypeScript★ 14↓ 12.1K/Monat16. Okt. 2026

jdiejim/chiltepinDocs your AI agent can write and your CI can check. Markdown + typed YAML blocks for diagrams, API docs, ADRs, and slides, rendered by code, never drawn by the model.
TypeScript★ 3↓ 427/Monat21. Okt. 2026
npm63MittelGesundheitsindex
TypeScript★ 2↓ 1.286/Monat13. Sept. 2026